Introducing Atlas: Web3 Data Provider Performance Dashboard
by Nichanan KesonpatPUBLISHED Jul 3, 2024
We are excited to announce Atlas, a dashboard tool for comparing web3 data providers. Our goal in building Atlas was to help developers make informed decisions on which provider to use based on their specific data needs and for researchers to gain accessible insights into how well each provider fares across chains, regions, and data types.

What is Atlas
Atlas is a filterable, time-indexed dashboard that compares the latency of data providers across different chains and regions. Starting with RPCs, we aim to expand the provider type to API providers and indexers.
Today on Atlas, you can:
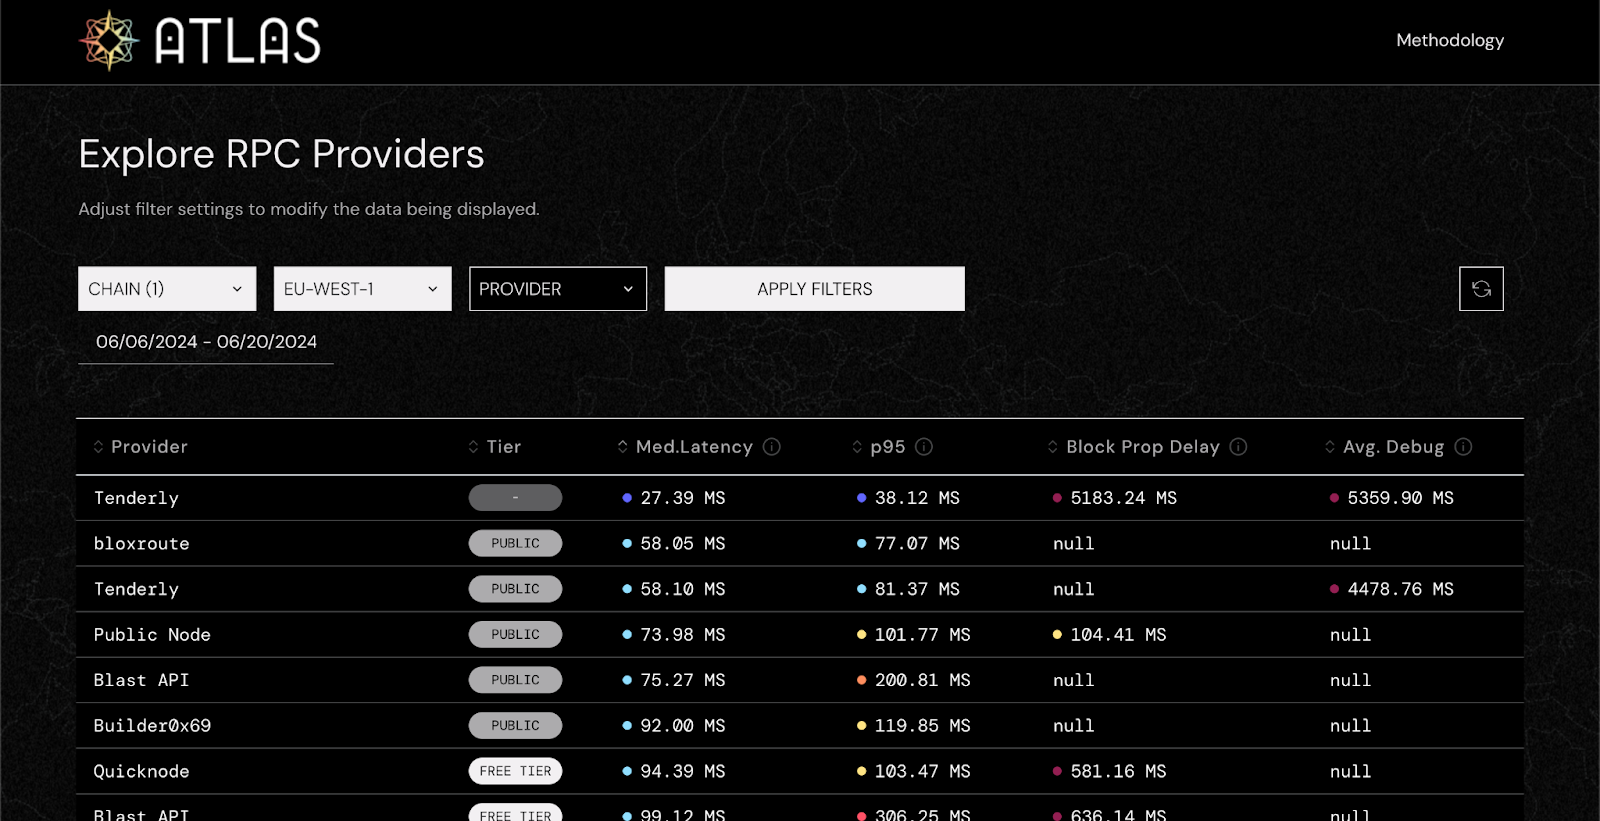
Use the dashboard to get an overview of RPC provider performance over a custom period.
Filter by chain, region, and provider to see median latency, p95, block propagation delay, and the average latency for a debug endpoint.*
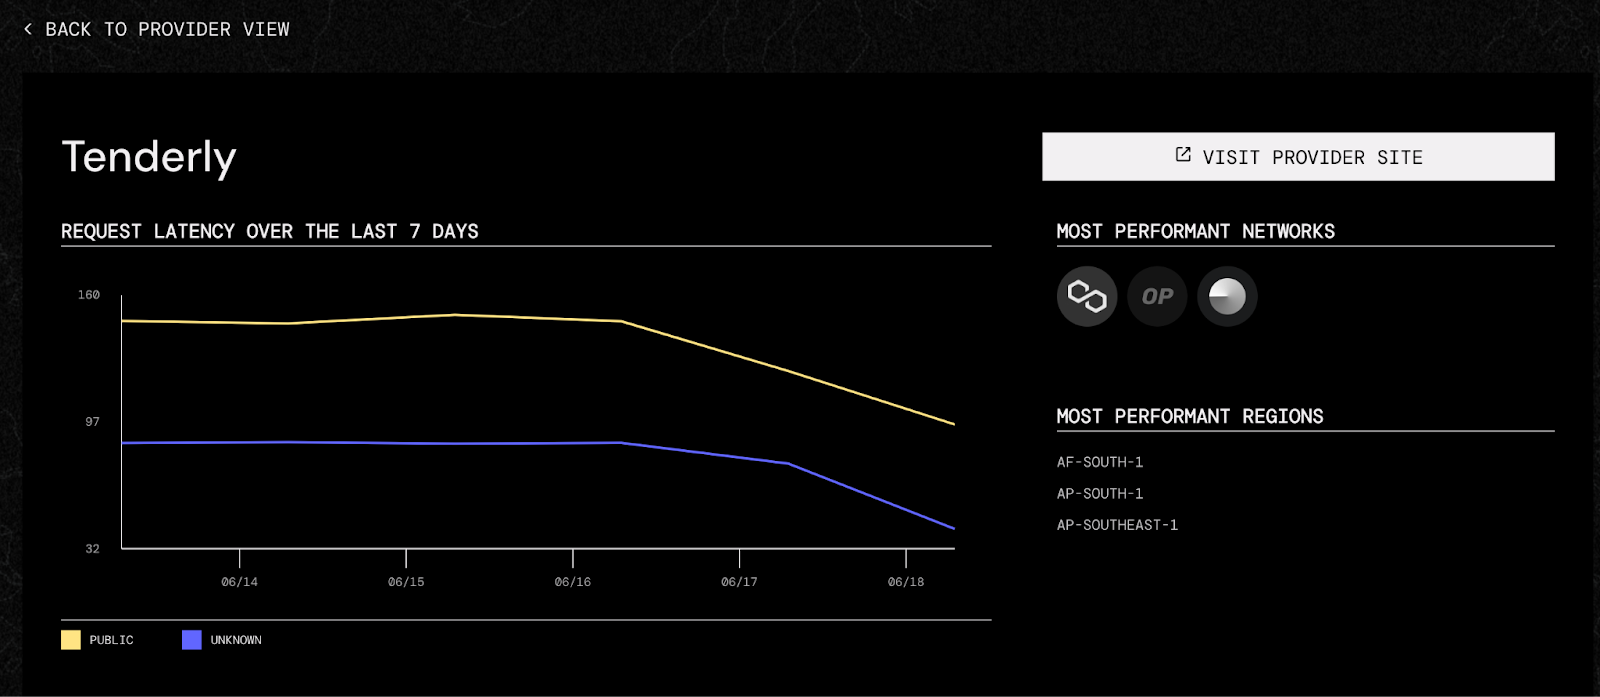
Navigate to a specific provider to gain further insight into their request latency over the past seven days, the most performant chains and regions, latency across the chains they offer, and the availability of WebSocket vs. HTTP endpoints.

Who is Atlas for?
Atlas can be used by:
Developers who want to compare RPC and other data providers’ performance for any given chain(s)
Researchers interested in monitoring data provider performance might use this data to inform reports and articles about providers and chains.
Providers may use this data to compare the performance of their infrastructure vs. that of others in the industry.
How Atlas works
For each endpoint, multiple independent probes are deployed per region to ping and measure response times from a given provider’s API. A probe scheduler is also deployed per region to spawn, orchestrate, and execute their respective probes. Each endpoint supports the default JSON-RPC scheme provided by the Ethereum Foundation, ensuring compatibility with any EVM-compatible chain.
Implemented in Rust, these probes send all measurements to a single BigQuery database. Daily queries transform the raw data into its final form, ready for analysis in Looker Studio.
Probes
Several probes measure different aspects of RPC latency:
erc20_balance: Measures the time to query the balance of a wallet for a given ERC20 token.
eth_balance: Measures the time to query the balance of a wallet for the native chain token.
eth_block_number: Measures the time to query the current block number of the chain.
http_basic and websocket_basic: Measure the response times for HTTP and WebSocket requests.
websocket_block_propagation and websocket_mempool_propagation: Measure block and mempool transaction propagation times over WebSocket connections.
Looker Studio
Data is analyzed on Looker Studio, which converts the raw data into customisable dashboards to provide insights such as:
Best location per chain: Average request latency per region.
Lowest request latency by region: Detailed breakdown of latency metrics by region.
Fastest chains and providers: Overall performance metrics by chain and provider.
You can navigate to Atlas’ full Methodology page for more details.
What's Next for Atlas?
Submission flow for data providers to add their endpoints. Atlas is launching with 38 RPC providers for comparison, we want a streamlined way for new and existing providers we may have missed to include themselves as well.
Improving UI/UX on the dashboard. Faster load times, more filters, and customizable historical performance view.
Expanding from RPCs to API providers and indexers. This includes non-standardized abstracted endpoints such as token, NFT, and transfers
Adding data for paid endpoints. Atlas currently compares free or public endpoints, but paid endpoints with SLAs can tell a different performance story. We’d like to work with data providers for the best way to incorporate these in the dashboard.
Adding more networks (Bitcoin, Solana, etc.)
Disclaimer: This article is for general information purposes only and should not be construed as or relied upon in any manner as investment, financial, legal, regulatory, tax, accounting, or similar advice. Under no circumstances should any material at the site be used or be construed as an offer soliciting the purchase or sale of any security, future, or other financial product or instrument. Views expressed in posts are those of the individual 1kx personnel quoted therein and are not the views of 1kx and are subject to change. The posts are not directed to any investors or potential investors, and do not constitute an offer to sell or a solicitation of an offer to buy any securities, and may not be used or relied upon in evaluating the merits of any investment. All information contained herein should be independently verified and confirmed. 1kx does not accept any liability for any loss or damage whatsoever caused in reliance upon such information. Certain information has been obtained from third-party sources. While taken from sources believed to be reliable, 1kx has not independently verified such information and makes no representations about the enduring accuracy or completeness of any information provided or its appropriateness for a given situation. 1kx may hold positions in certain projects or assets discussed in this article.